


كلية الزراعة طرابلس
المزيد ...حول كلية الزراعة طرابلس
حقائق حول كلية الزراعة طرابلس
نفتخر بما نقدمه للمجتمع والعالم
253
المنشورات العلمية
184
هيئة التدريس
522
الطلبة
0
الخريجون
أخبار كلية الزراعة طرابلس

2022-05-10
941
0
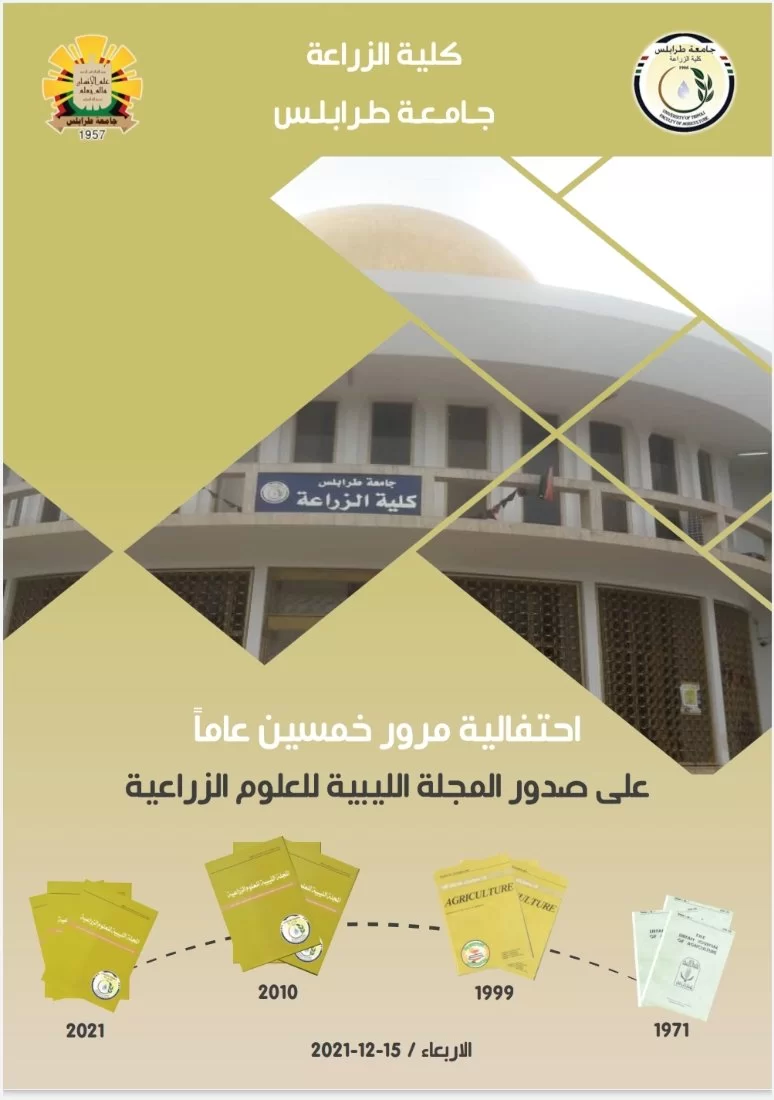
2021-12-12
2367
0

2022-05-10
941
0

2021-12-12
2367
0
من يعمل بـكلية الزراعة طرابلس
يوجد بـكلية الزراعة طرابلس أكثر من 184 عضو هيئة تدريس


أ. عبدالرؤوف مصطفى عمر الوصيف
عبدالرؤوف مصطفى عمر الوصيف هو احد اعضاء هيئة التدريس بقسم المراعي والغابات بكلية الزراعة طرابلس. يعمل السيد عبدالرؤوف الوصيف بجامعة طرابلس كـامحاضر مساعد منذ 2019/5/22 وله منشورات علمية في مجال تخصصه